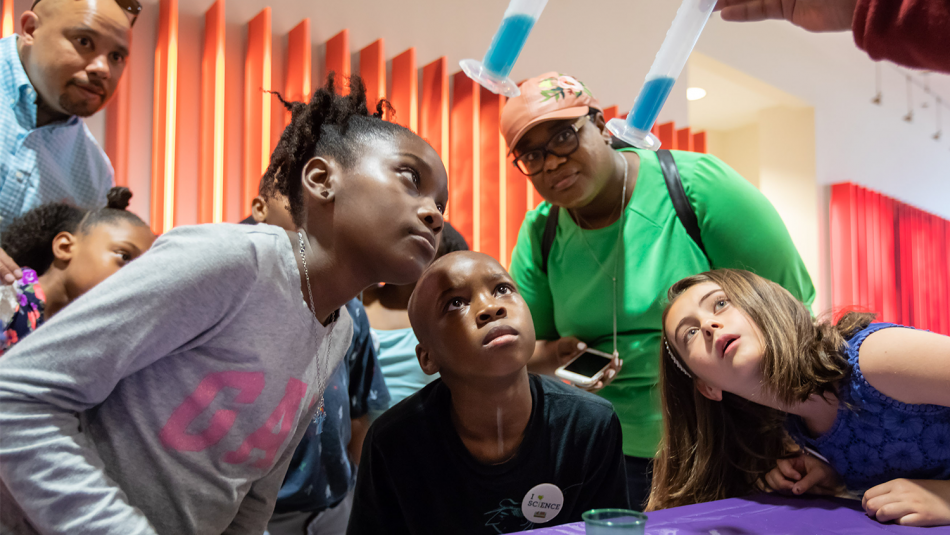
Advancing K-12 education through innovation in teaching, learning and leadership, we bring together students, teachers, researchers, policymakers and educational professionals to foster collaborations that improve education for all learners.
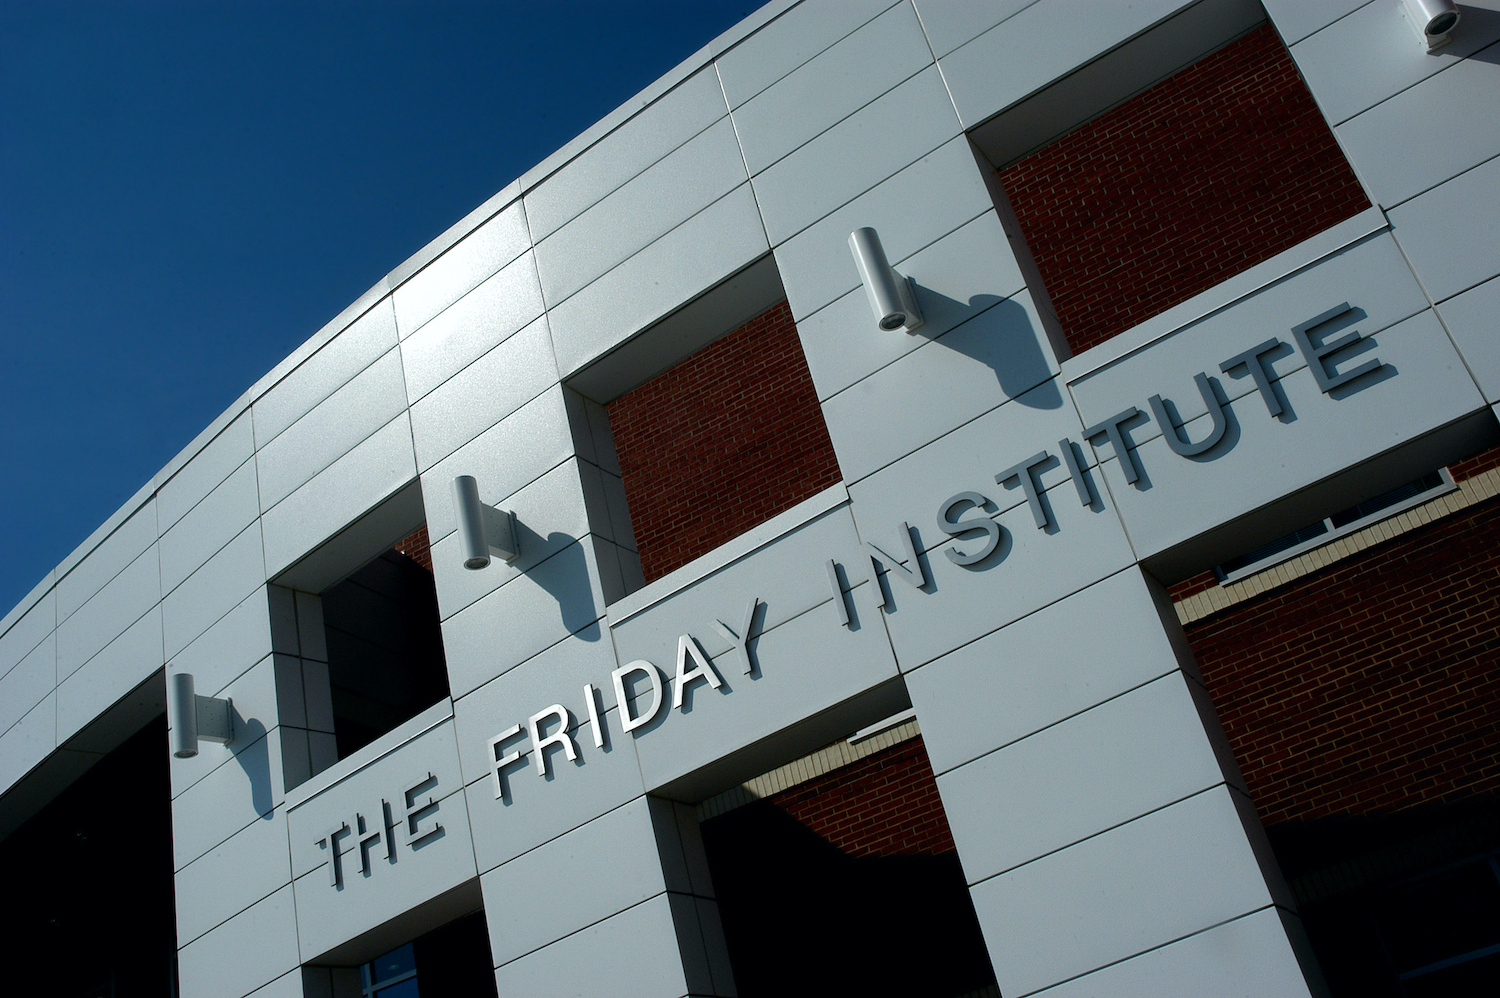
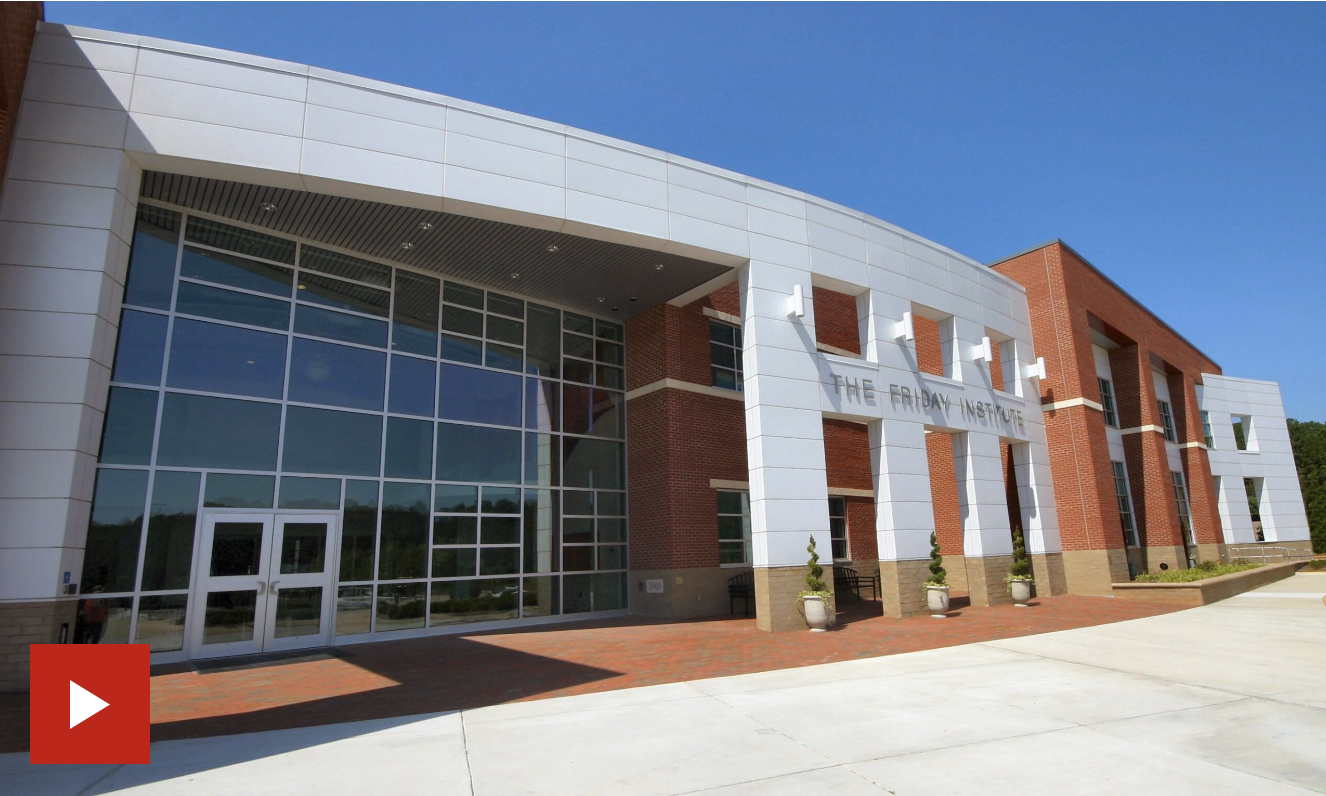
Friday Institute Celebrates 20 Years on NC State’s Centennial Campus
On April 15, 2004, the Friday Institute broke ground on its building on NC State’s Centennial Campus. Since its opening, the Friday Institute has become a leader in K-12 education practice, research and policy, constantly shifting and changing its priorities as needed in K-12 education.
When I think of the Friday Institute, I think of support, partnership, collaboration, innovation. When I’m in a box and I need thought leadership on any of those areas, my first turn is to the Friday Institute.
Dr. Anthony Jackson
Superintendent, Chatham County Schools
Computer Science Professional Development
The Friday Institute partners with educational leaders and policy makers from the school to national level to create opportunities for ALL students in North Carolina to explore computer science.
The Friday Institute convenes and connects stakeholders to catalyze change and innovation in education. See below for the resources we provide to the groups we serve and partner with.
The AI with the Friday Institute’s AI Learning Lab aims to create a network of educators utilizing AI who are willing to provide their expertise, experiences and/or artifacts for the benefit of their education peers and evidence of their digital leadership.